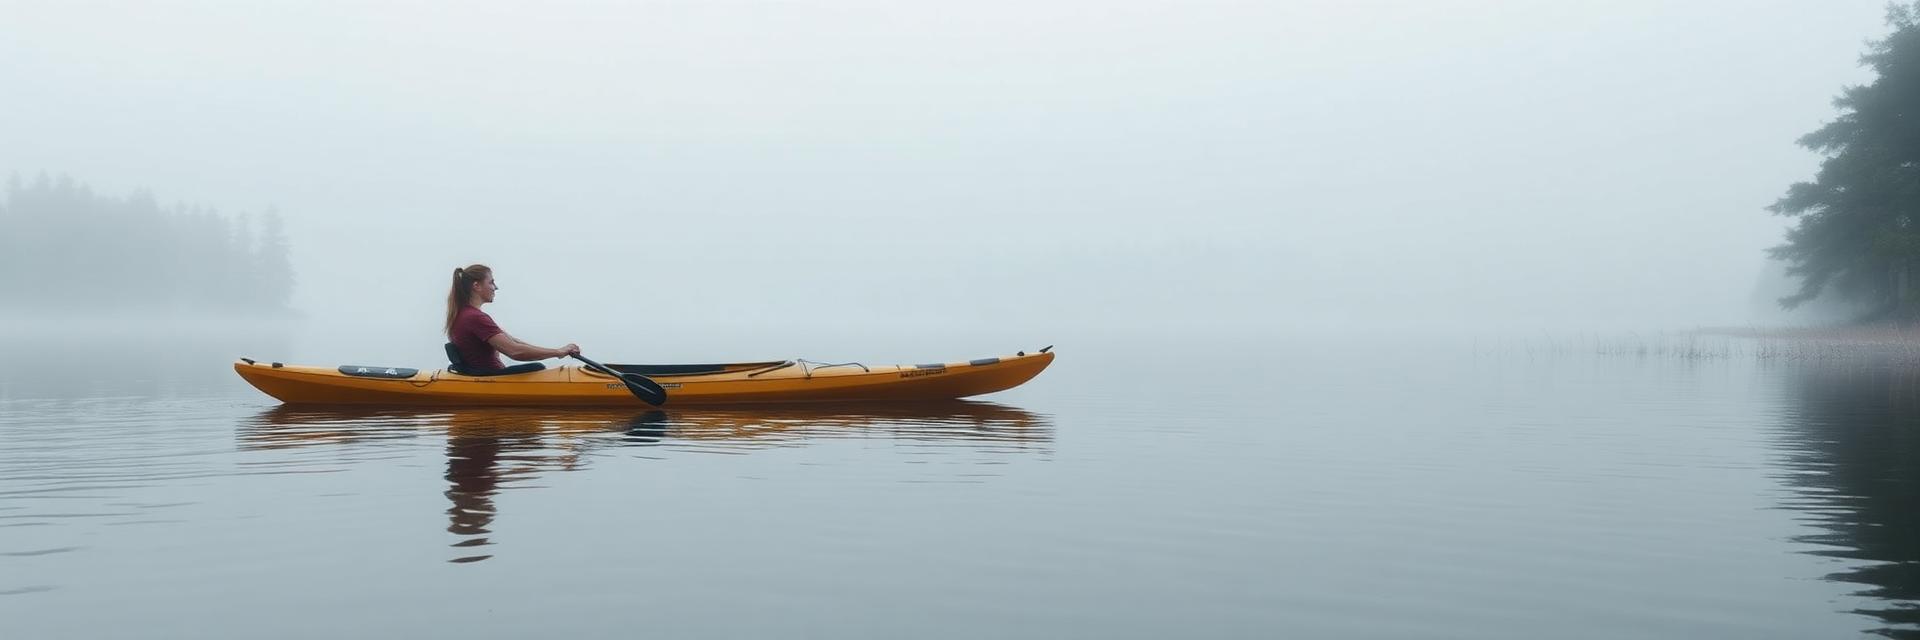
How heatwaves, storms, and drought have actually affected your lake.
What it answers
How is our lake responding to a changing climate?
$900In stock
Checkout arrives with the store connection. Orders attach to the lake on your account.
Product category
Physical ProductShips to you
ConsumableLab testing
ServiceBy the Lake Pulse Boathouse
CombinationKit with multiple items
Delivered digitally
Available in delivered within 15 business days of ordering. contact the boathouse if you need a specific date range confirmed for coverage first.
Delivery
Delivered to your Portal — no shipping, no waiting on a box.
If something's wrong
Damaged, missing, or a result that looks off — tell us and we make it right.
Overview
Archived satellite imagery used to reconstruct how extreme weather has changed your lake over time — freeze and thaw patterns, shoreline change, weed activity, and other indicators of how the water responds to a shifting climate.
Available in three tiers.
Turnaround
Delivered within 15 business days of ordering. Contact the Boathouse if you need a specific date range confirmed for coverage first.
When to use it
What problem does this solve for our lake?
Climate effects on a lake are gradual, cumulative, and almost impossible to perceive from the shoreline. Ice-out arriving two weeks earlier than it did in the nineties changes the entire growing season — stratification sets sooner, the productive period lengthens, and bloom risk rises — but nobody experiences that as a change. They experience one warm spring.
The satellite archive holds the record. Freeze and thaw dates, shoreline position, and vegetation extent reconstructed across decades turn a diffuse worry into specific numbers with dates attached.
That matters practically as well as intellectually. A lake whose ice-free season has lengthened by three weeks has a different management problem than it had thirty years ago, and monitoring designed for the old lake will be timed wrong for the new one.
What's included?
Historical reconstruction of climate and extreme weather impacts from archived satellite imagery
Freeze and thaw pattern analysis across the covered period
Shoreline change and vegetation activity indicators
Storm, heatwave, and drought event impacts
Three tiers available
Delivered as an interpreted report, not raw imagery
Results loaded into your lake's account
What's not included
Field sampling or laboratory chemistry. Satellite observation infers conditions from reflectance; it does not measure water.
Detection of anything below the surface. This is a surface-optical method.
Toxin measurement or species identification
Guaranteed coverage on any given date. Cloud cover and satellite revisit intervals decide what imagery exists.
Regulatory or compliance determinations
Requirements
Your lake's location and boundary
The time period you want covered, and the question behind it
Realistic expectations about cloud gaps. Some dates simply have no usable imagery, and no amount of processing recovers them.
A Plus, Lake Admin, or PRO subscription to have results loaded into your Lake Pulse account
Contact the Lake Pulse Boathouse if you have questions.
What you get back
Results
A dated record of how your lake's seasonal cycle has shifted
Freeze and thaw trends, which are among the most sensitive climate indicators available for a lake
Documented impacts of specific storm, heat, and drought events
A basis for re-timing monitoring to the lake you have now rather than the one you had
Results load into your lake's Data Library in the Lake Pulse Portal
Data can be charted in the Analytics Hub, used to trigger alerts, or shared with your board and members
Results are found in your lake's portal, accessible only to Plus, Lake Admin, and PRO subscription tiers
Pro tips
Ice-out is the headline number. It is easy to explain, it is well documented in the archive, and it is what makes the change legible to a board.
Re-time your sampling against it. A programme designed around a mid-April ice-out is sampling the wrong weeks if ice-out is now late March.
Longer ice-free seasons mean longer stratification, which means more time for bottom water to go anoxic. That connects directly to sediment phosphorus release.
Pair it with a weather station. History explains the trajectory; live data explains this week.
This is the least urgent and most strategic product in the satellite line. It changes how you plan rather than what you do tomorrow.
Lake Pulse sells measurement and monitoring — not treatment or remediation. What you buy here positions you to solve the problem, and to prove whether it worked.
Results sync to your Portal with Plus, Lake Admin & PRO
Results from this product land on your lake's timeline in the Portal — next to everything else your lake has ever measured, instead of in an inbox.
Where sediment has been disturbed on your lake, and how that has changed.
Answers: Where is sediment being disturbed on our lake, and is it getting worse?
Results sync to your Portal with Plus, Lake Admin & PRO
Delivered digitally·Available in delivered within 15 business days of ordering. contact the boathouse if you need a specific date range confirmed for coverage first.
Twenty years of bloom history, without twenty years of monitoring.
Answers: Are our blooms getting worse, or does it just feel that way?
Results sync to your Portal with Plus, Lake Admin & PRO
Delivered digitally·Available in delivered within 15 business days of ordering. contact the boathouse if you need a specific date range confirmed for coverage first.
What is happening on your lake right now, without waiting for a field visit.
Answers: Something is happening on our lake. How big is it and where?
Results sync to your Portal with Plus, Lake Admin & PRO
Delivered digitally·Available in delivered within 3 business days of ordering, subject to usable recent imagery being available.
$50
View
Satellite · Delivered digitally
Historical Survey - Climate & Extreme Weather
Includes: Historical reconstruction of climate and extreme weather impacts from archived satellite imagery · Freeze and thaw pattern analysis across the covered period · Shoreline change and vegetation activity indicators …
$900
Lake Pulse
Every lake deserves a timeline. Yours can start this morning.