01 — Your lake's dashboard
The first screen: current conditions, weather on the lake, what changed since last week, and what needs a person to look at it.

Lake Pulse Portal
Your dashboard, map, data, history, and neighbors in one shared place.
What the Portal is
The Portal is the web home for your lake — the dashboard your association opens before a meeting, the map you point at, the record that outlives the board. It's also the door to the Boathouse and the ledger of what your lake has bought from the Toolbox.
Your subscription tier determines how much of it you can reach.
Core functions
Not features for the sake of features — the jobs a lake community needs done, in the order you tend to need them.
The first screen: current conditions, weather on the lake, what changed since last week, and what needs a person to look at it.
Every sampling site, buoy, inlet, and cove pinned on your own lake. Tap a point to see what's been measured there and when.
Four domains — water quality & algae, invasive species, nearshore conditions, and lake vulnerability — read at a glance, never boiled down to one grade.
Every reading with its source attached: your lab results, agency data, satellite passes, sensors, and decades of imported history.
Trend lines by place and season, the Lake Health & Safety Index, Flora & Fauna tools, and exports in the formats agencies and grant reviewers accept.
Blooms, fish kills, storm runoff, drawdowns, ice-out dates. Dated, documented, and still there when someone asks three years from now.
Treatments, monitoring programs, shoreline projects, funding history, permits, and alerts — what was done, when, by whom, and what the data did afterward.
Geotagged photos from the shoreline and a running thread where neighbors report what they're seeing and others weigh in.
See who else on your shoreline subscribes, what tier they're on, and how much of the lake is covered so far.
What was recently bought from the Toolbox, by whom, for your lake — and one door into the Boathouse when you need an expert.
Current conditions and recent trends for your lake's immediate area, so wind, temperature, and rainfall sit next to the data they influence.
A running library of 110 lake health & safety parameters — what each one means, how it is observed or tested, and where it appears in your lake's shared record.
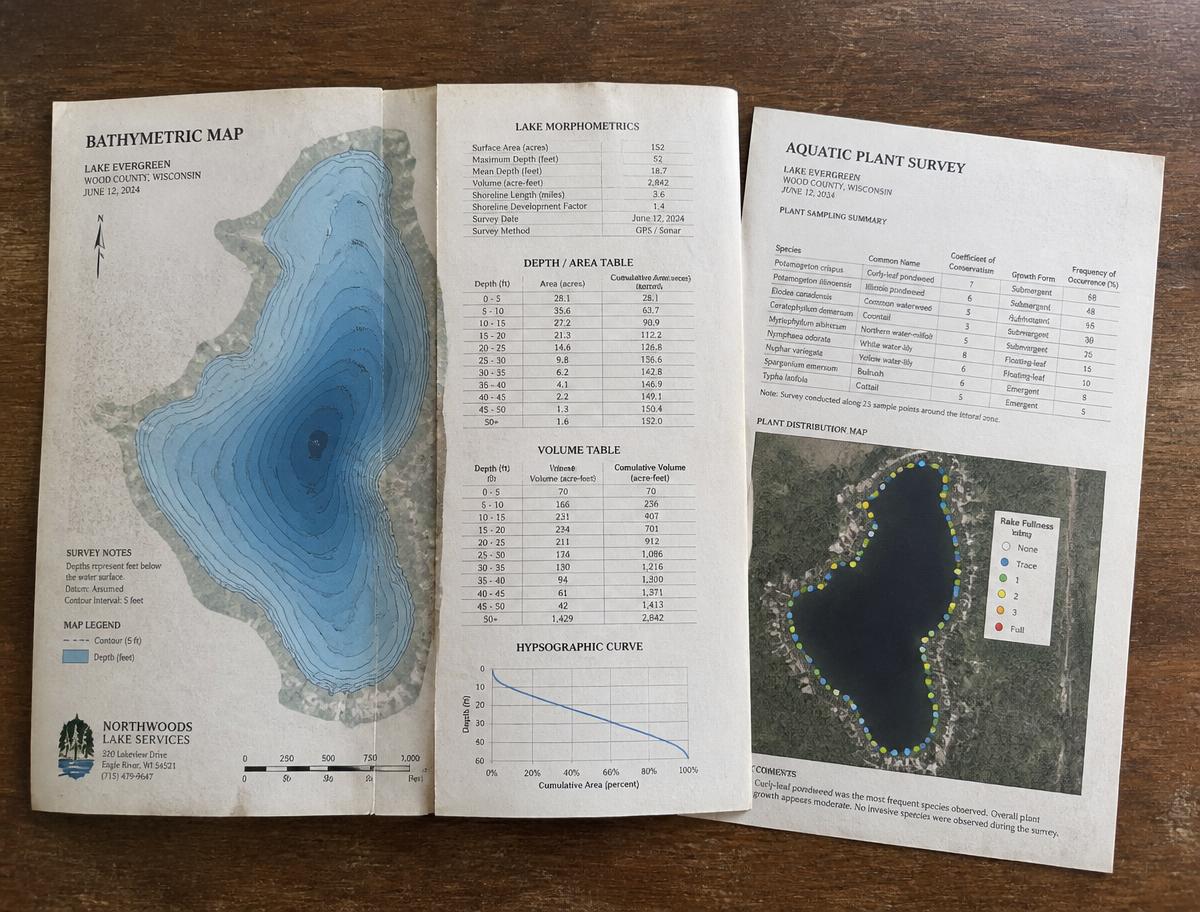
Old lab reports, studies, surveys, maps, and images in one searchable place, linked to the sites and dates they describe.
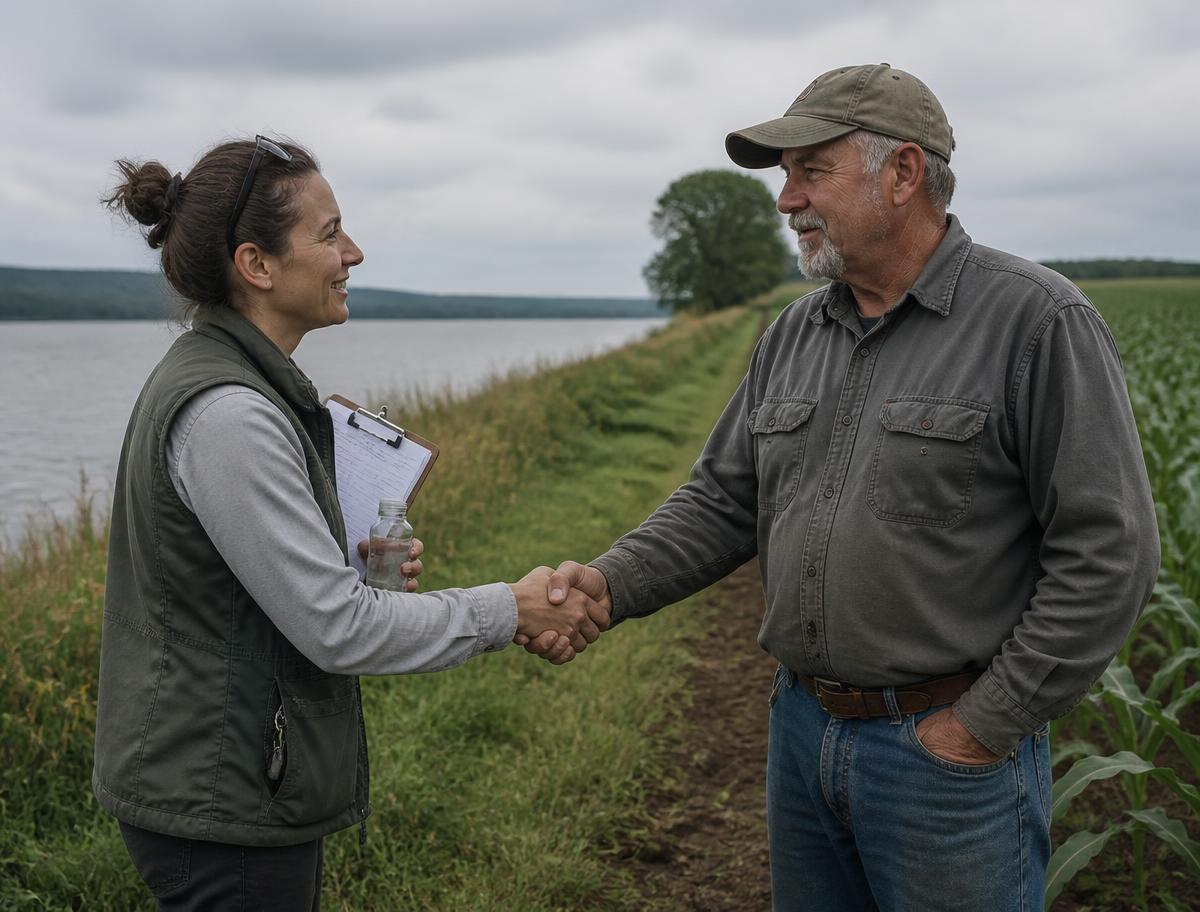
A summary of who you collaborate with on data: local nonprofits, government, companies, universities, and state agencies tied to your lake's work.
Add, remove, activate, or inactivate sampling and monitoring locations around the lake so the map always matches the work being done.
The Lake Health & Safety Snapshot, Index, Trends, and Flora & Fauna analytics tools — each designed to answer a different kind of question.
Updates from your Lake Admin, plus funding, permit, alert, and project history. When an alert is required, it appears in the Portal and is pushed by email and text.
The lake map
The map holds place: sites, coves, inlets, buoys, and the depth of the record at each one. Every sampling site and sensor is pinned to the spot it belongs to — tap a point for its full history.
See the Analytics hub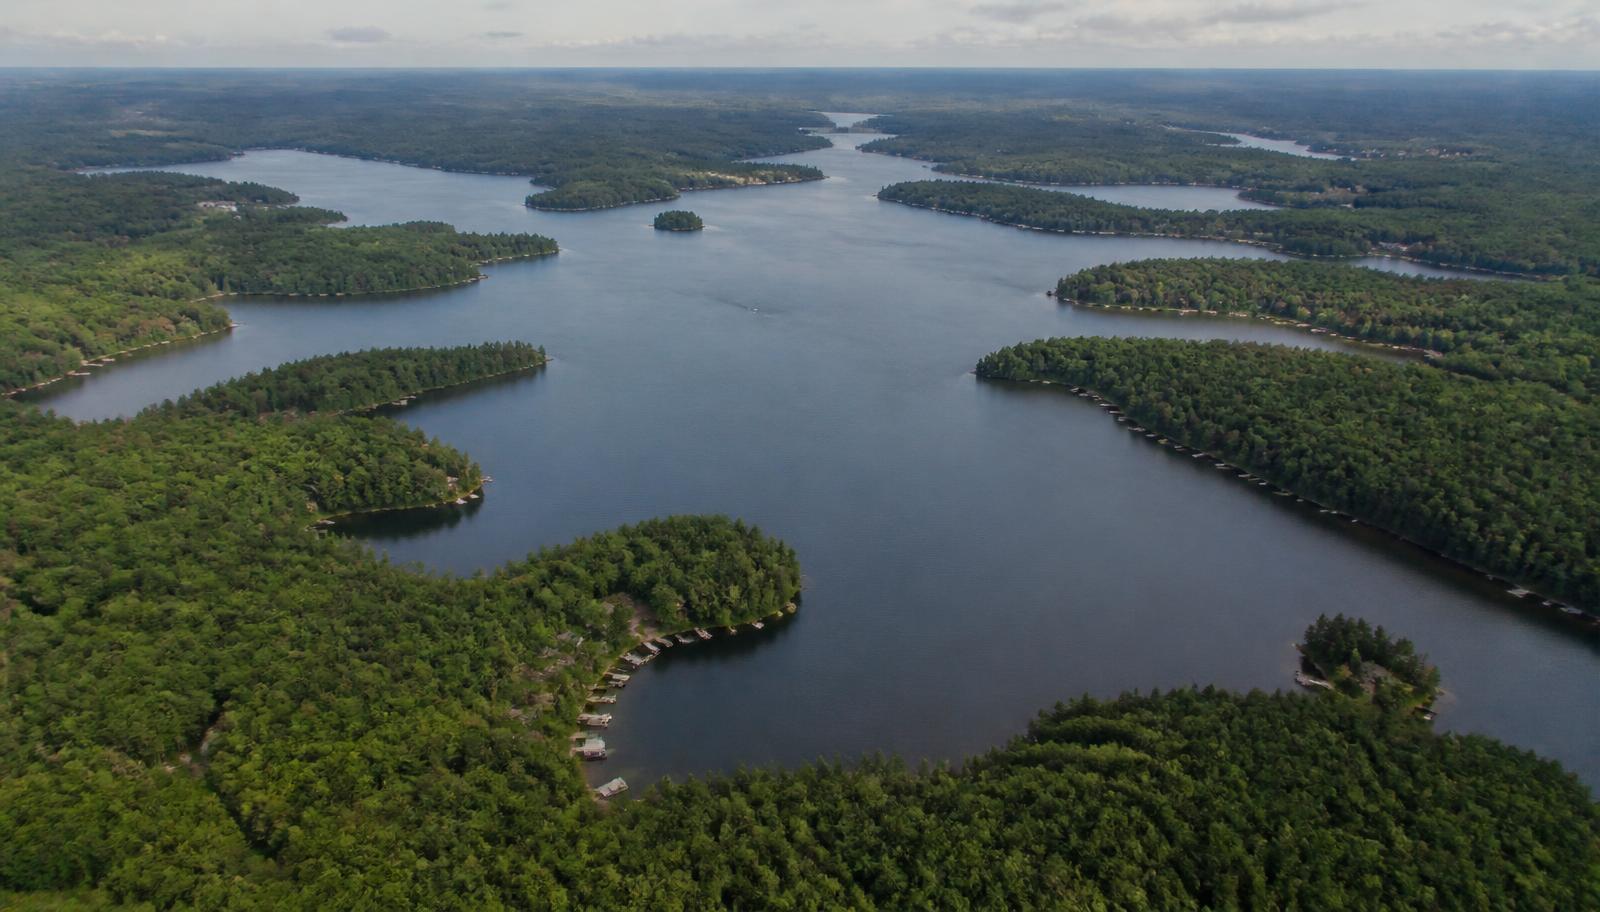
Analytics hub
The Snapshot, the Index, Trends, and Flora & Fauna. Work most lakes could only get by hiring it out — now within reach of your lake, on your subscription.
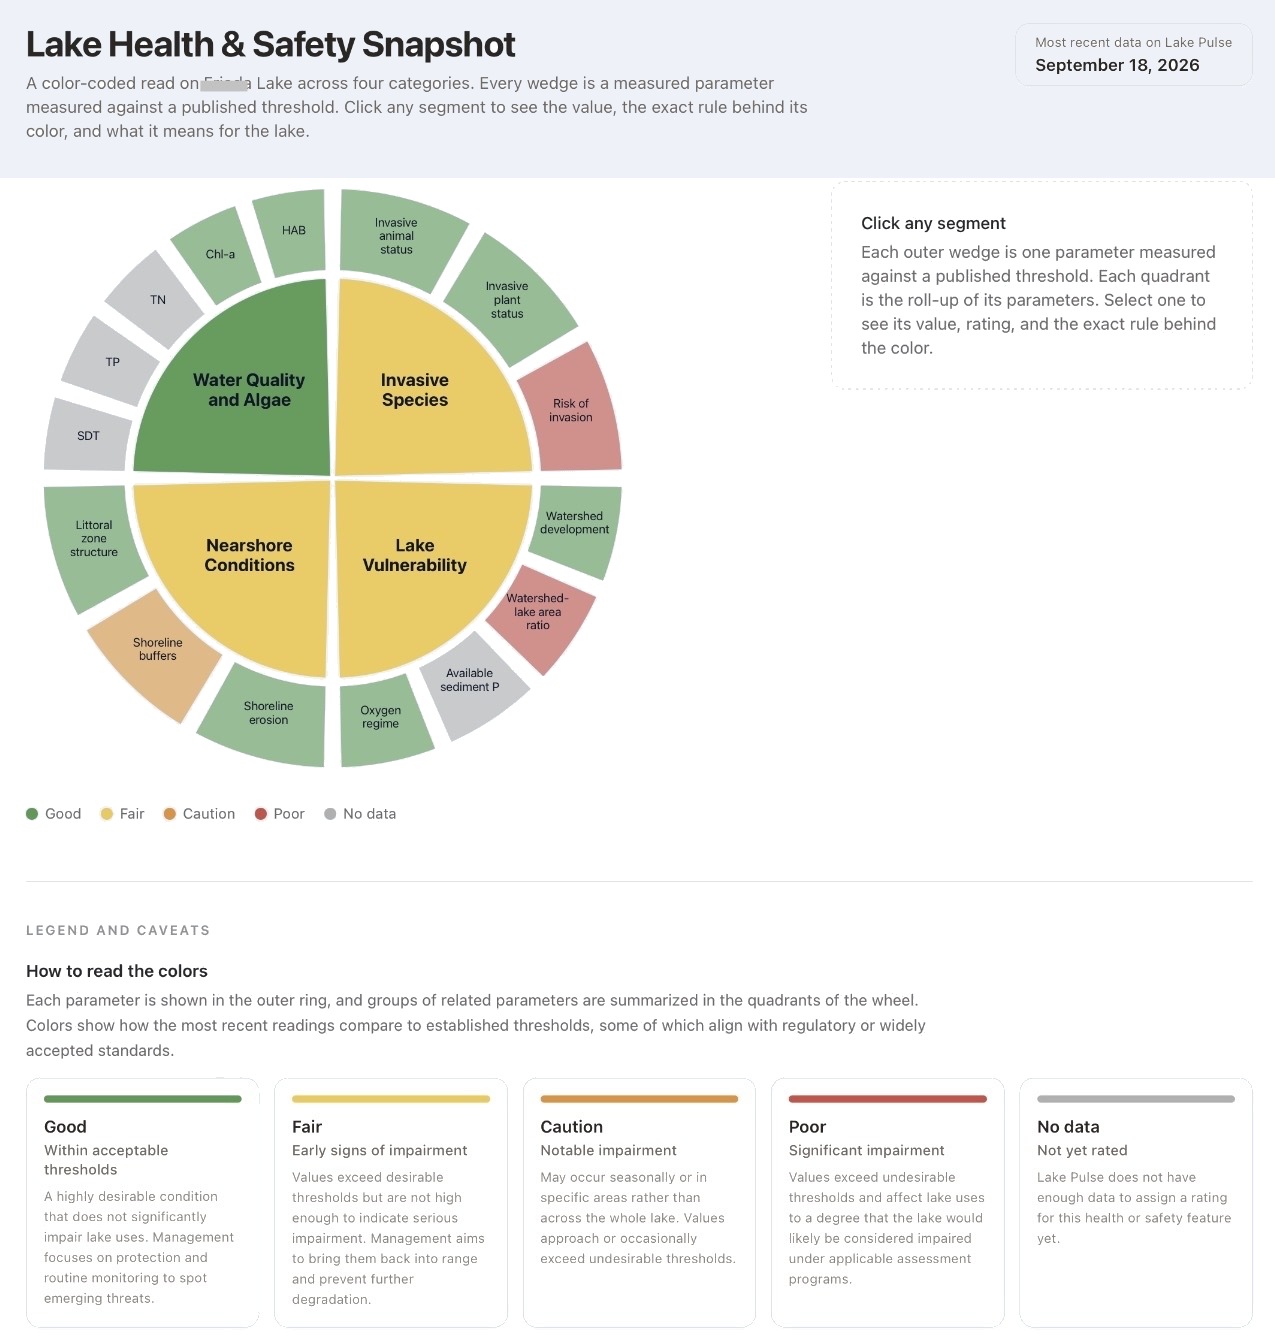
Four domains, read together, never collapsed into one grade. Each segment carries a color for its condition — and grey where the data isn't there yet.
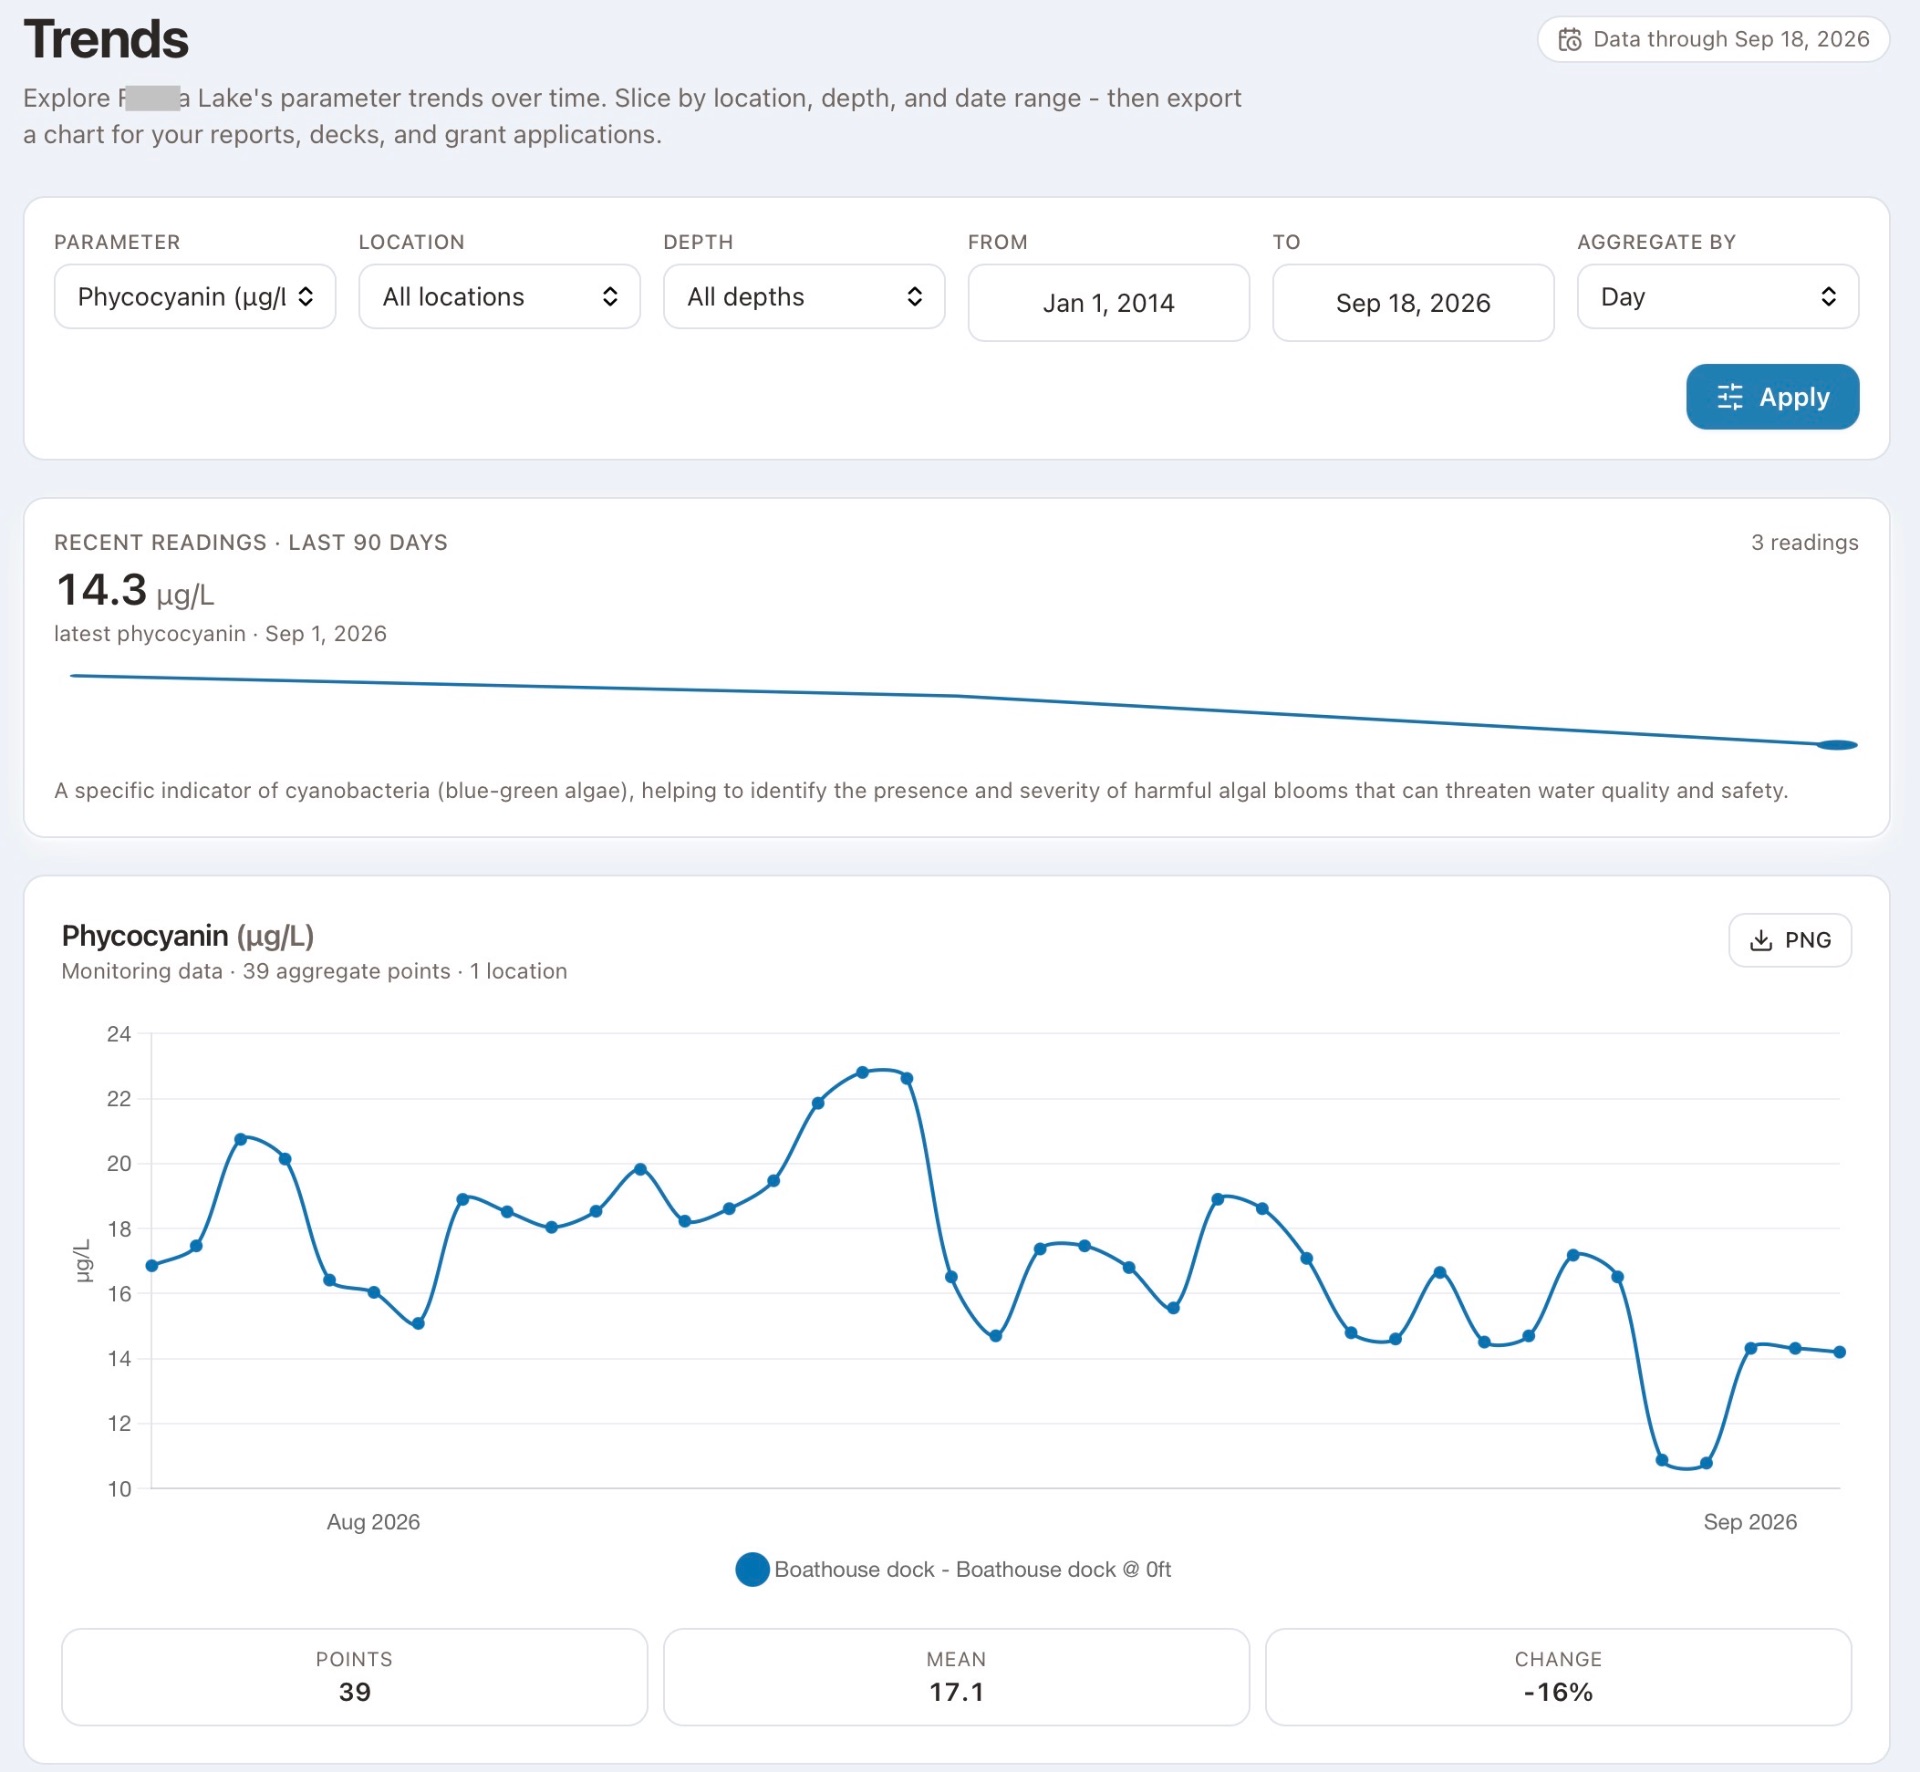
Direction and rate of change for any parameter, at any location, across any season — the long view that a single sample can never give you.
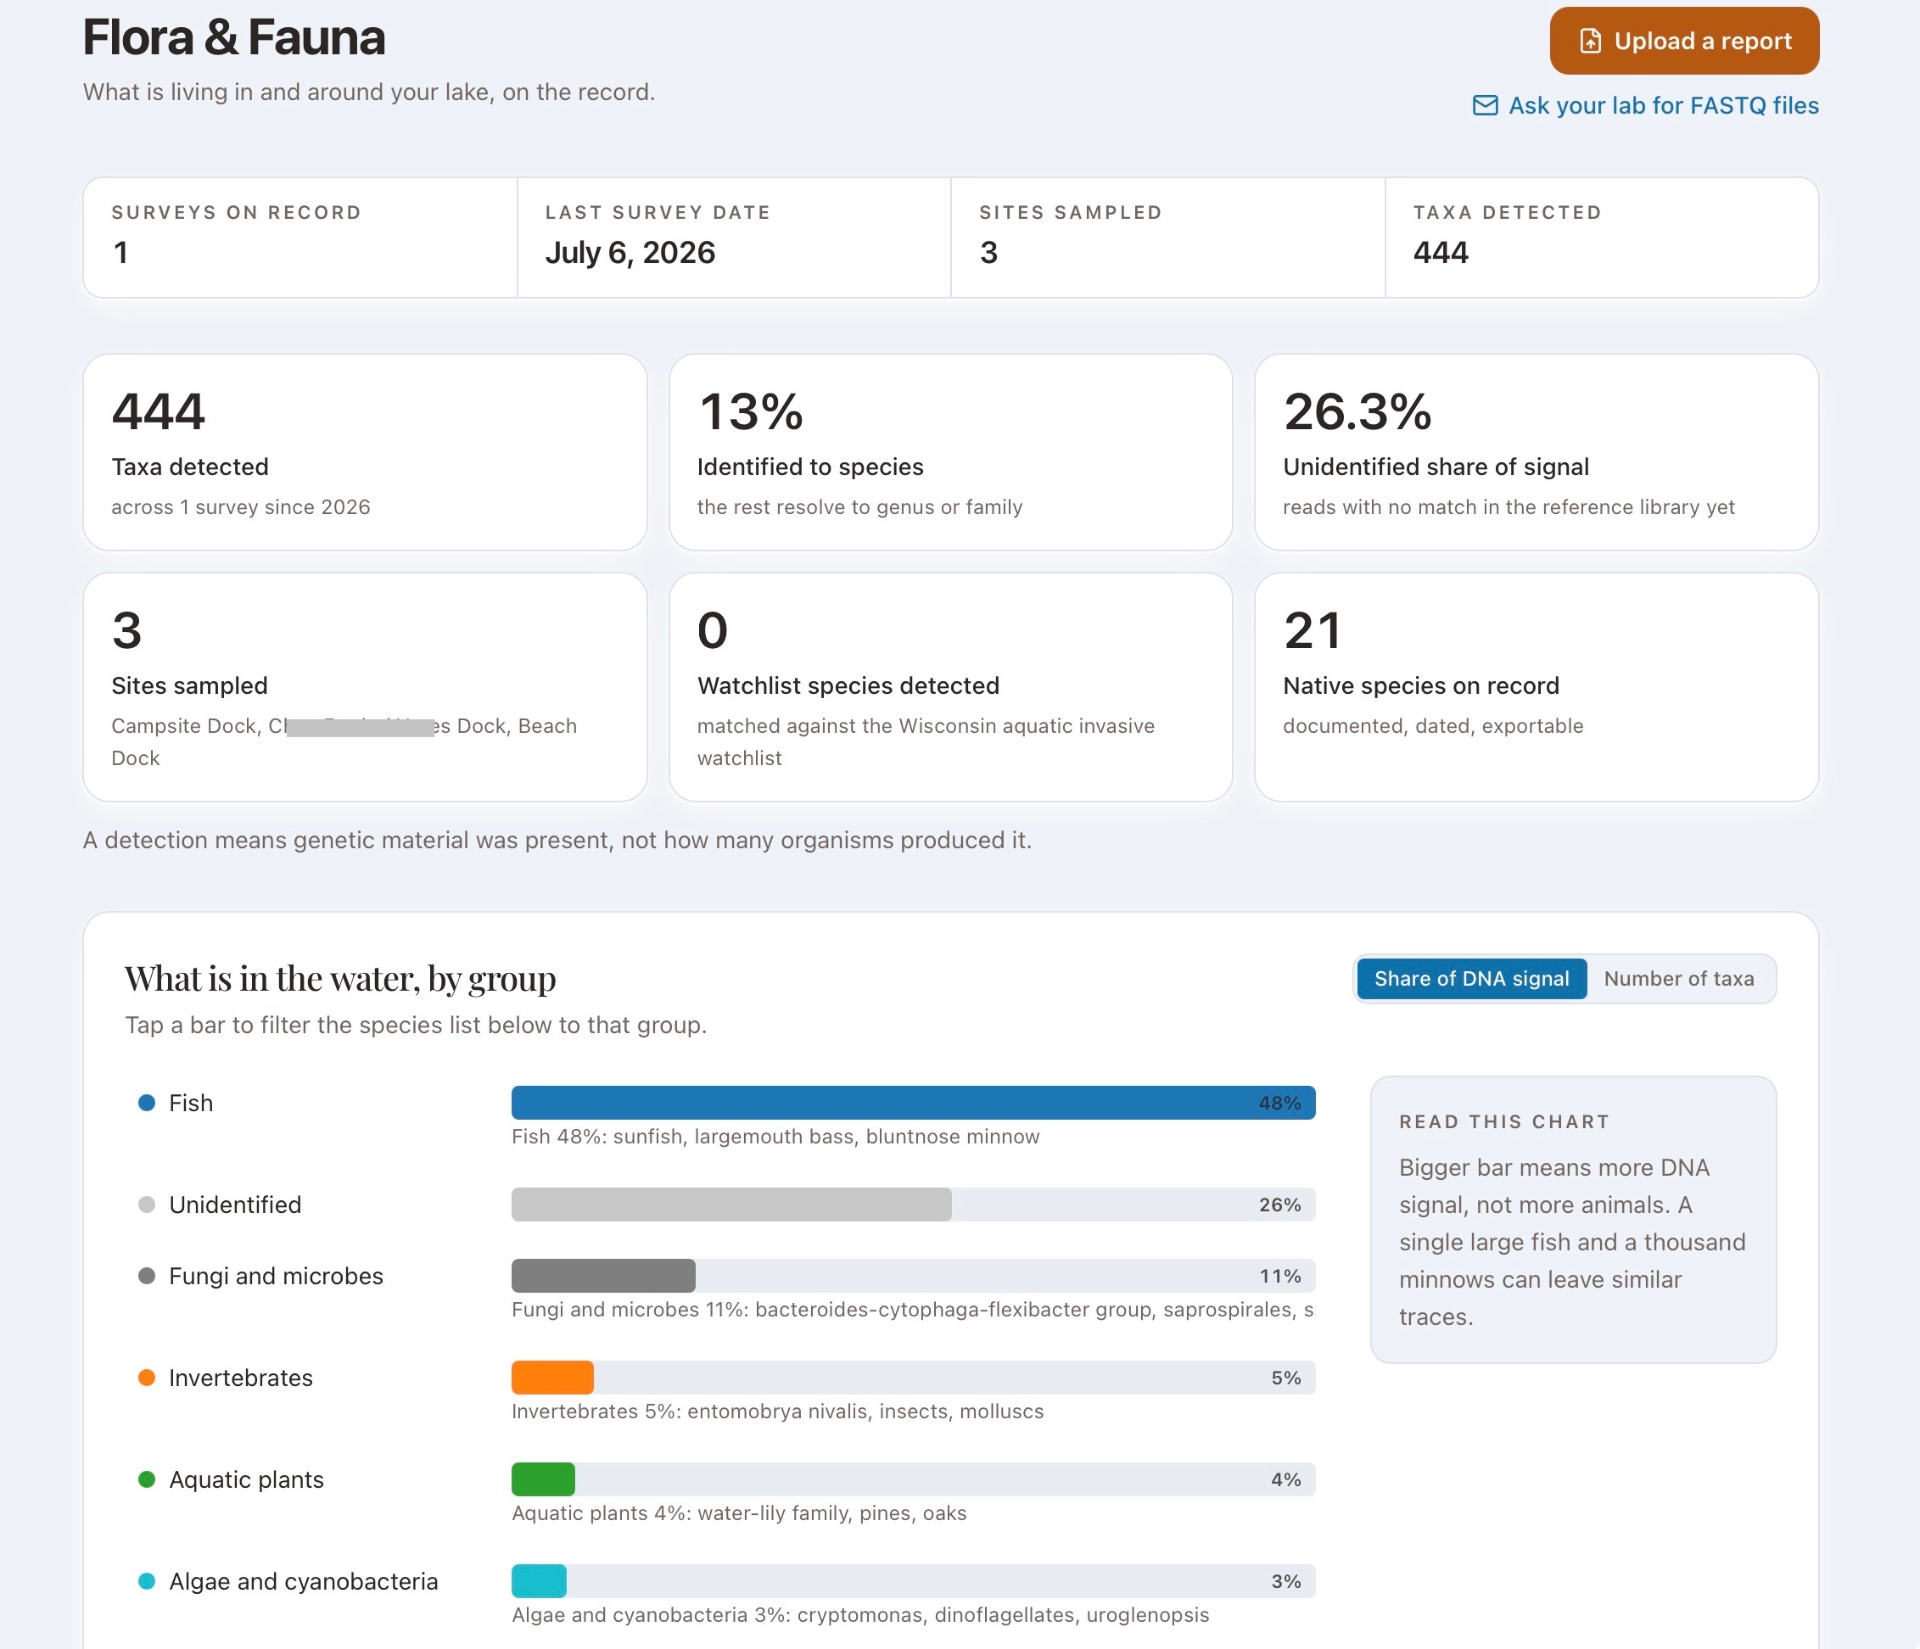
Results from eDNA and eRNA surveys, species observations, and invasive sightings — what lives in and around your lake, and what's newly showing up.
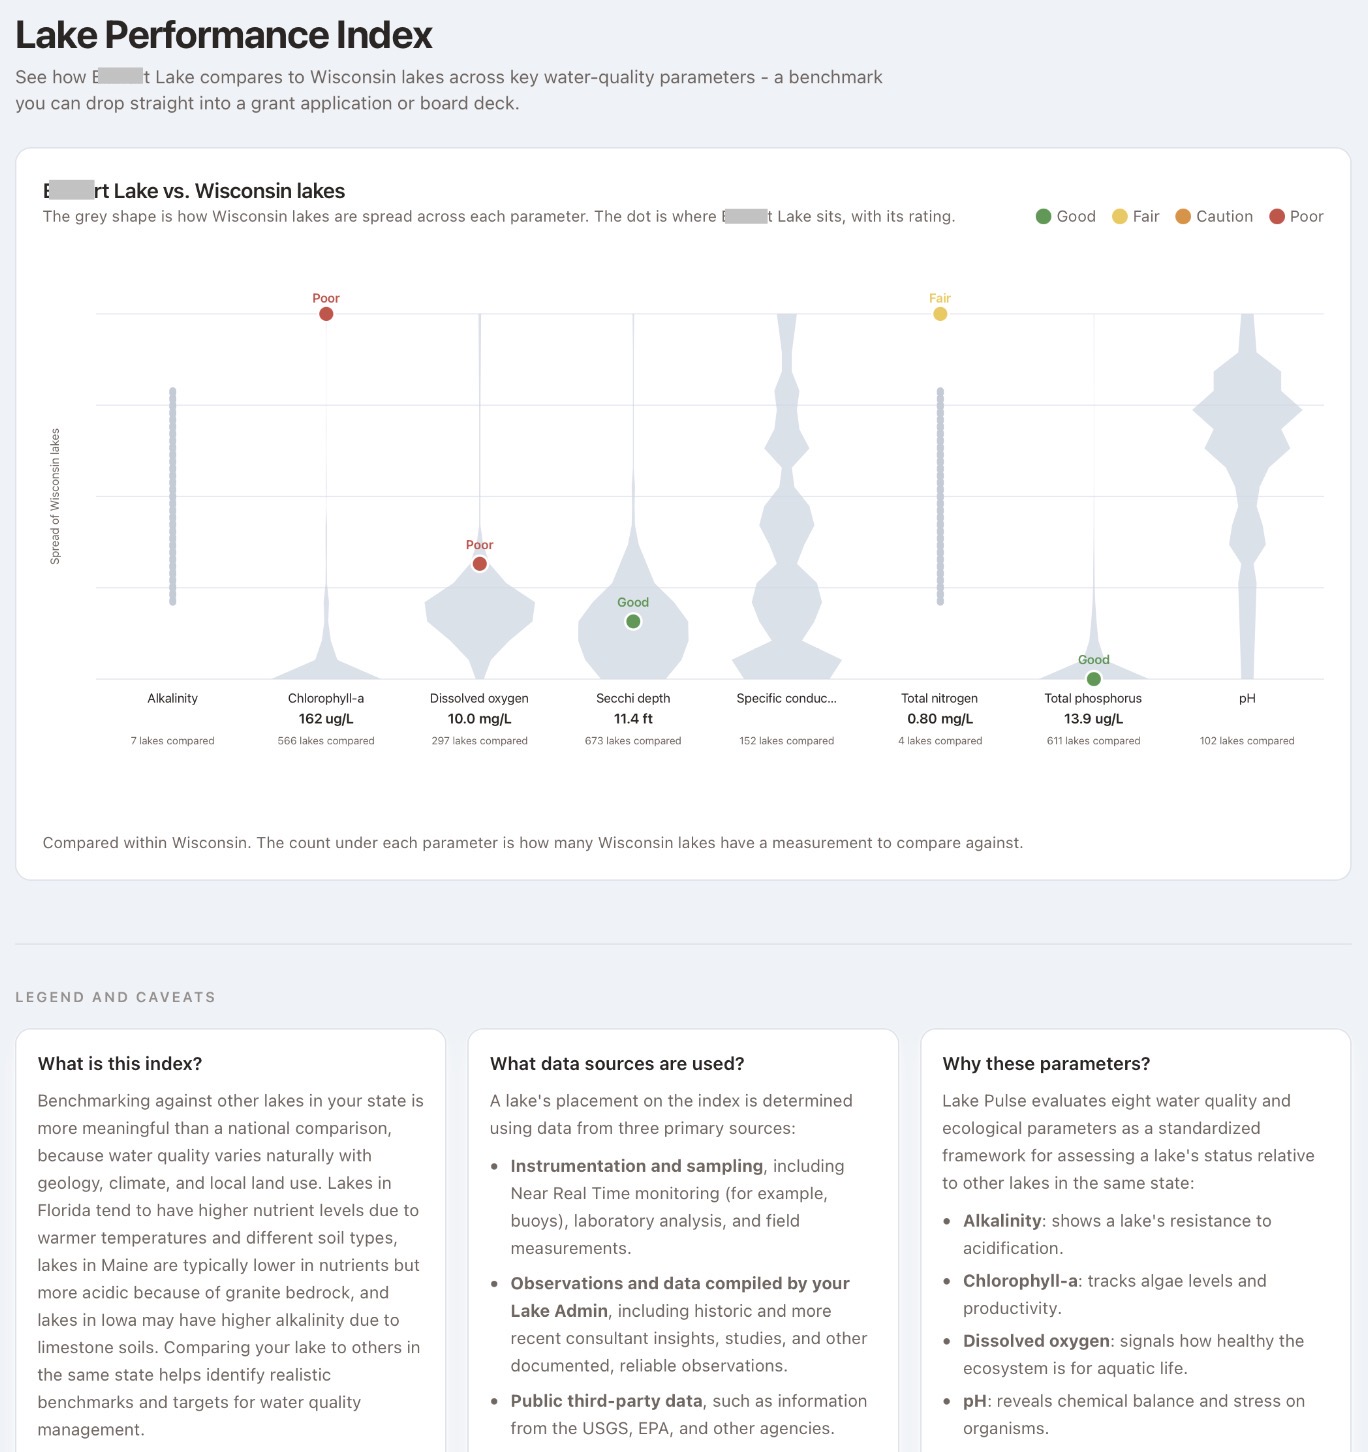
Every tracked parameter in one table: latest observed value, units, direction of travel, and status — so you can see the whole record at once.
Why the wheel matters
Aggregating a lake into a single number is the kind of shorthand that looks authoritative and isn't. Average a good shoreline into a failing water column and you get a lake that “scores fine” while one part of it is quietly in trouble. That is irresponsible at best and destructive at worst — a bad grade invites alarm without direction, and a comfortable one invites complacency.
The Snapshot doesn't collapse those signals. It still scores — nothing else could — but it scores four categories separately: Water Quality & Algae, Invasive Species, Nearshore Conditions, and Lake Vulnerability. Each is shown as a color rather than a number, and the indicators behind every color stay visible, so you can see where the lake is doing well and where it needs work.
Seeing lots of grey? That means there isn't enough data yet — not that the lake is fine, and not that it's failing. Grey is the honest answer, and it tells you exactly where to spend your next dollar.
Access
On the free Member tier, the Lake Snapshot is the one analytics tool you can open — and we made it the one that matters most. The Index, Trends, and Flora & Fauna unlock with a paid subscription.
Compare subscriptions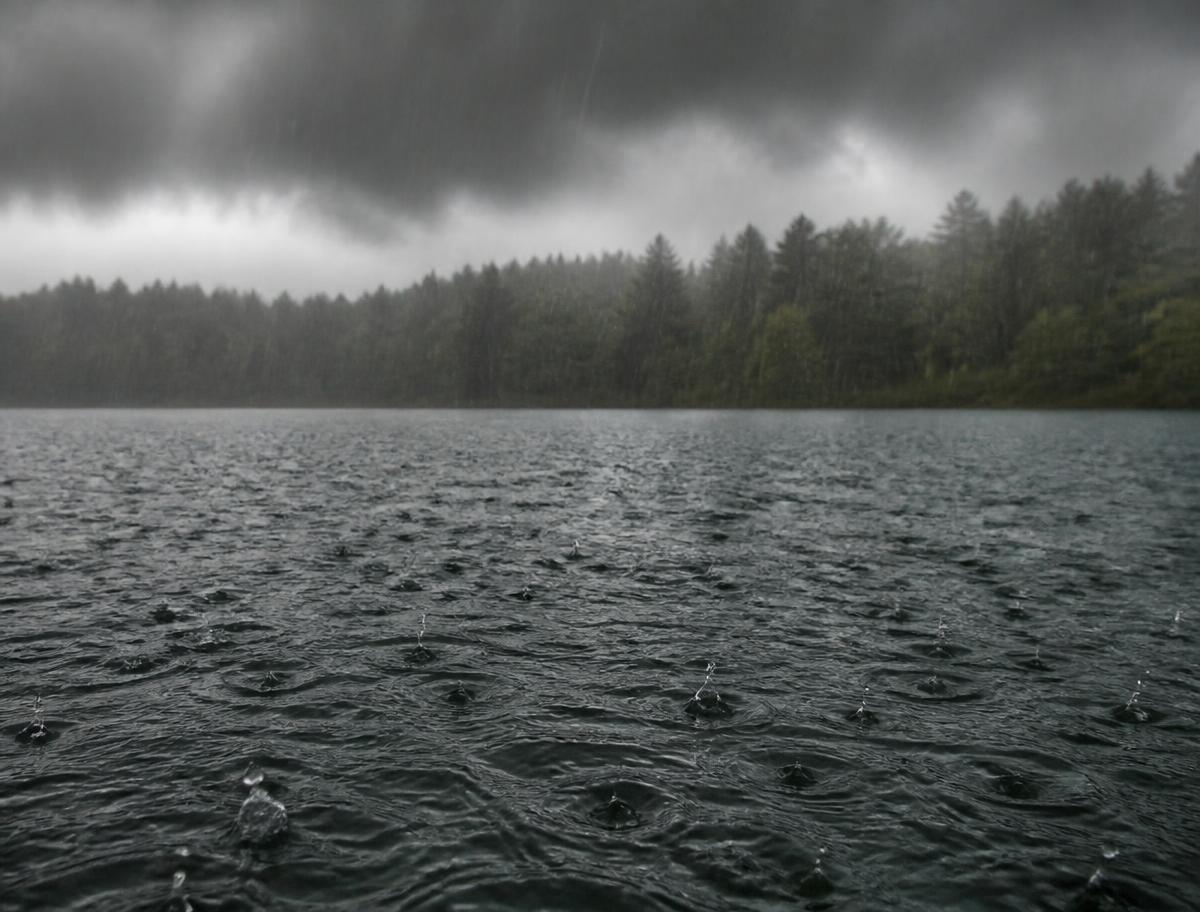
Current conditions and recent trends for your lake's immediate area. Wind, temperature, rainfall, and ice-off sit next to the data they influence so you can connect what the sky did to what the water did.
Air & water temp
Daily and seasonal
Wind & direction
Mixing and drift
Rainfall
Runoff events
Ice-on / ice-off
Season length
Add your own weather station
Regional forecasts tell you about the area. A station on your lake tells you about your lake — and its readings land here automatically.
Add your own weather stationA running record of key lake health & safety parameters. It doesn't judge your lake against someone else's idea of normal — it tells you when something was observed, tested for, or calculated, where the number came from, and what the value or observation actually was. That's how you learn what's been measured, and when.
Every entry carries its date, its method, and its source. Gaps show up as gaps.
Documents & Reports
Old lab reports, studies, surveys, maps, and images in one searchable place, linked to the sites and dates they describe. When a new reading comes in, it sits beside the history that explains it.
Data Partners
A summary of the organizations contributing to or drawing on your lake's data — local nonprofits, municipal and county government, farms and companies, universities, and state agencies — with their role and current projects.
Location manager
Add, remove, activate, or inactivate sampling and monitoring locations around the lake. The map always matches the work being done, and the data always knows where it came from.
Add & remove sites
Activate or inactivate
Deep holeThe inletThe landingBack coveLake Admin & alerts
Updates from your Lake Admin — funding history, permit history, alerts history, and project history — live in the Portal. When an alert is required, it is clearly displayed and pushed out by email and text.
Grants, assessments, and project budgets tracked over time.
Drawdowns, treatments, and shoreline permits in one shared record.
Past advisories and how they were communicated to the lake community.
Monitoring programs, treatments, and restoration work from start to follow-up.
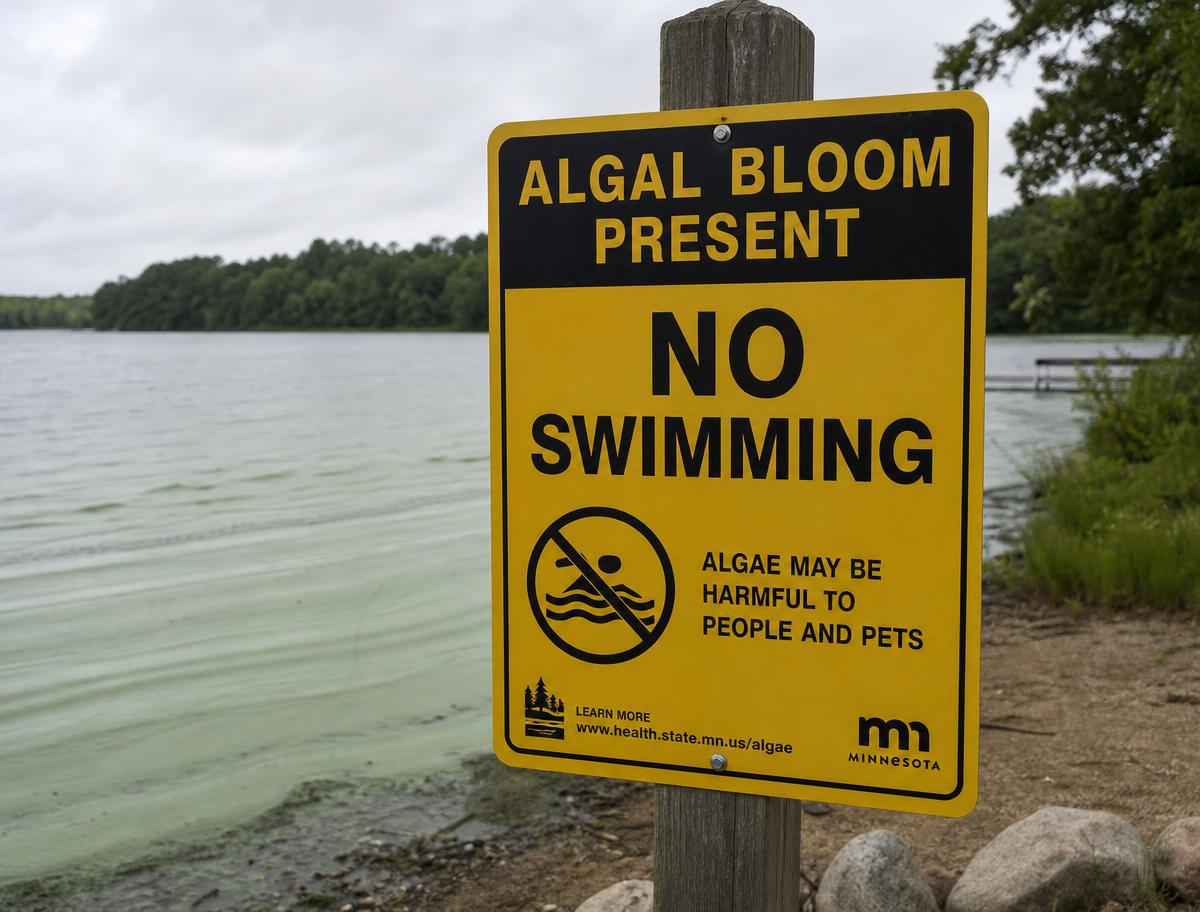
If your Lake Admin marks an alert as required, it appears prominently in the Portal and is pushed to subscribers by email and text — so the right people see it whether they're at their desk or on the dock.
Field Images & Field Notes
A photo with a time and a place on it is evidence. A neighbor's note that the north cove went green on a Tuesday is evidence. Both land in the same record as your lab results.
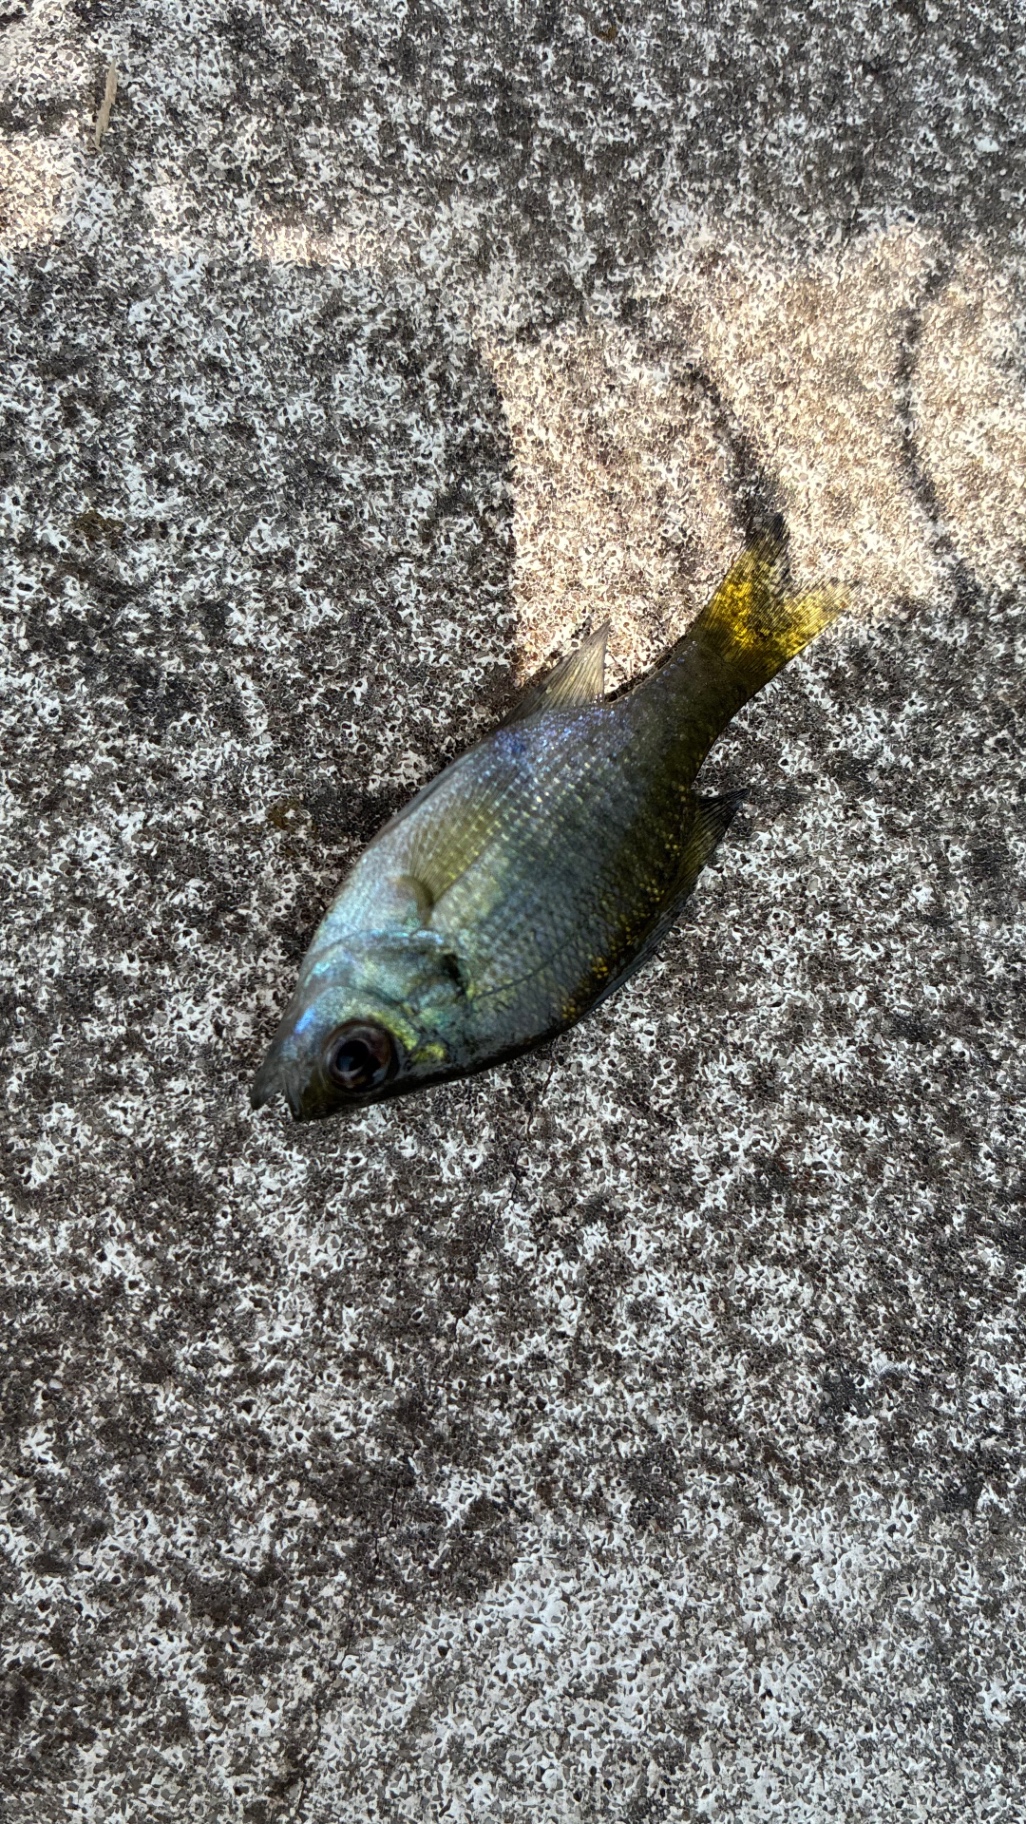
Fish kill, three observed along 40 ft of shoreline.
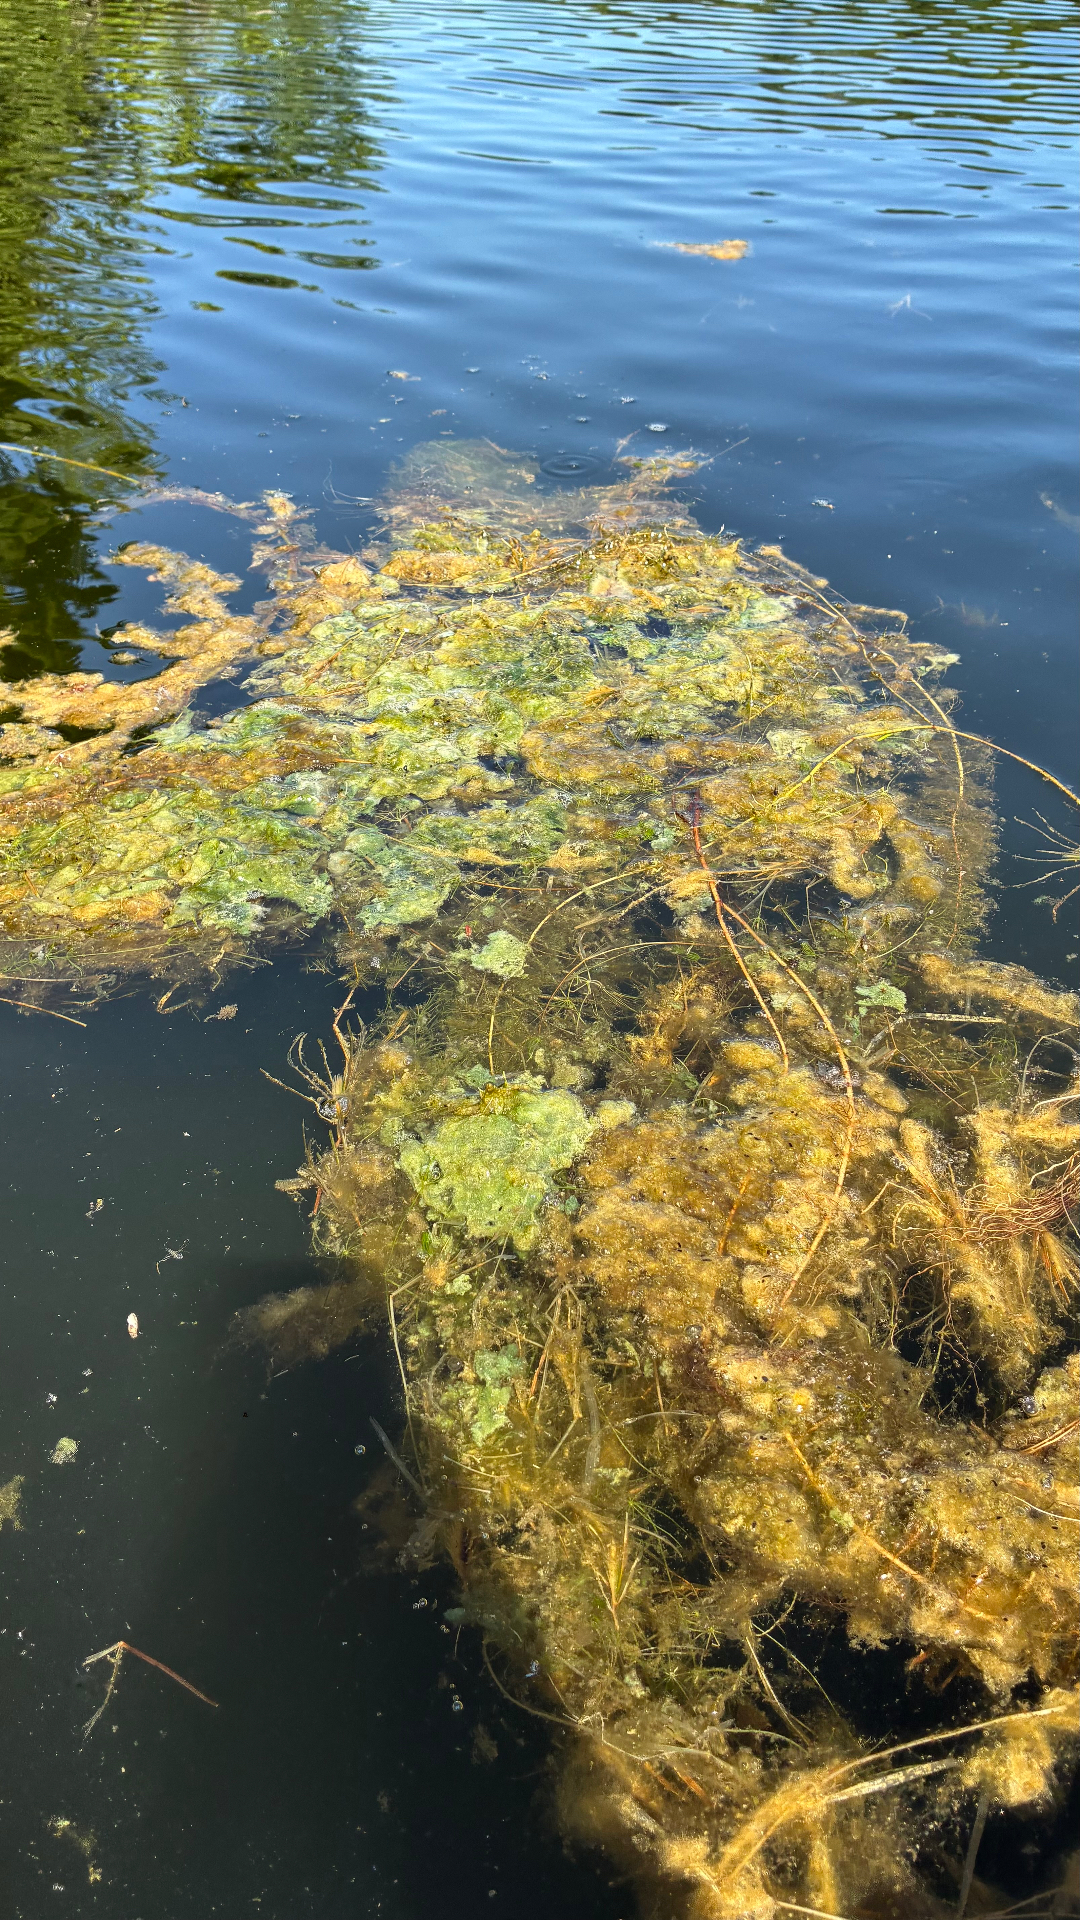
Surface algae mat drifting along the shoreline.
Every image is geotagged, dated, and attached to the site it came from — so next July you can put the two side by side.
Thread · North shore discoloration
Dana W. · Tue 7:12 AM
Basic subscriber · North Cove
Green streaking along the north shore this morning, worse than last week. Water looks like paint where the wind pushes it into the corner.
Ray T. · Tue 8:40 AM
Plus subscriber · The Landing
Same at the landing. Secchi read 1.4 m — was 2.2 m on the 3rd. Logged it and added two photos.
Caroline P. · Tue 9:05 AM
Lake Admin
Thanks both. Pulling a chlorophyll-a and a toxin screen from the Toolbox today and flagging the event in the record. Keep photos coming with a timestamp.
David K. · Tue 11:22 AM
Lake Pulse Boathouse
Given the wind direction and your July temperatures, sample the windward corner, not the deep hole — that's where the result will actually mean something.
Members read. Basic subscribers post and comment. Plus, Lake Admin, and PRO subscribers can pull the Boathouse into the thread.
The Portal and the app
Almost everything in the Portal is in the app too. The difference is posture: the app is for the moment you notice something; the Portal is for the evening you sit down and make sense of it.
Photos, notes, and readings go in where you're standing — dock, boat, or inlet — with location and time attached automatically.
The bigger screen is where trends, maps, exports, and program history get reviewed before a board meeting.
Anything captured in the app appears in the Portal, and anything organized in the Portal shows up in the app. No syncing to remember.
Access
Everyone on the lake can see something. What you can post, export, manage, and ask for depends on your level. Compare subscriptions.
Read-only. See your lake's dashboard, map, and public conditions.
Post Field Images, comment, and contribute to Field Notes.
Full data sources, analytics, exports, Toolbox result sync, and the Boathouse.
Everything above, plus program management, historic imports, sharing controls, and lake-wide administration.
Ask a limnologist about what you're looking at without leaving the screen you're looking at it on. A benefit for Plus, Lake Admin, and PRO subscribers.
Visit the BoathouseRecent Toolbox orders for your lake — what was purchased, by whom, and when the results are due back — so two neighbors don't buy the same test twice.
Browse the ToolboxData lives here
Lab results, field readings, sensor feeds, satellite passes, and forty years of paper records land in the same place, organized by site and season, and leave in whatever format a board, an agency, or a grant reviewer asks for.
Lab sheets, spreadsheets, photos, sensor feeds, and decades of history.
Every reading, with its source and site attached, in one shared record.
Cleaned, standardized, and sorted by place and season — not by folder.
Exports and sharing controls for boards, agencies, and grant reviewers.
The Portal